Project news Effect of pH on yield, biochemical composition and taste of Rhodomonas salina
Rhodomonas salina is a commonly used algal species for aquaculture feed, specifically in the production of copepods. R. salina has been shown in several studies in literature to be an ideal diet for copepods as it increases the survival, growth rate and egg production of the copepods. The positive effects of R. salina are mainly attributed to its favourable content of polyunsaturated fatty acids (PUFAs) with good concentrations of and eicosapentaenoic acid (EPA – C20:5-n3) docosahexaenoic acid (DHA – C22:6). Typically the fatty acid compositions of R. salina shows about 10% of the total fatty acids as EPA and 7% in DHA. R. salina has been characterized by high umami and seafood taste which enhances the application of R. salina in the food industry.
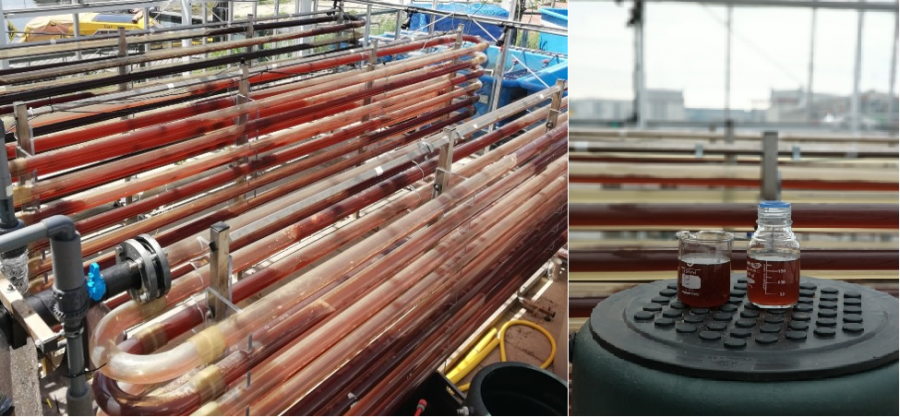
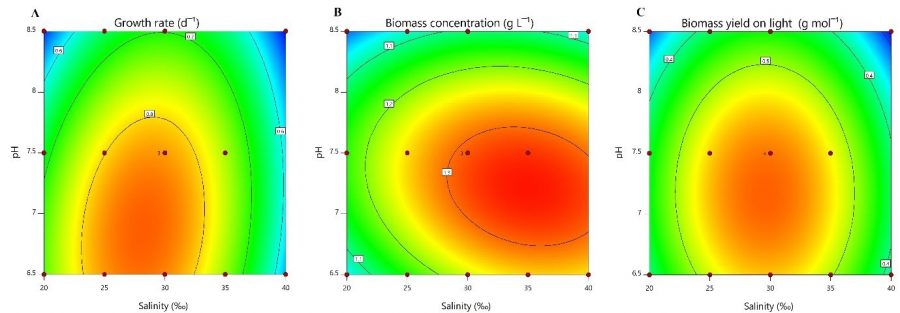
After MBA identified the marine cryptophytic microalgae of HZ as Rhodomonas salina (CCMP1319), HZ has focused on investigating the effect of pH and salinity on biomass productivity, biochemical composition and taste of R. salina. In lab scale, R. salina has shown a maximum growth and productivity at pH 7, while an increase in pH induced the accumulation of 5’-nucleotides, resulting in higher equivalent umami concentration at pH 8.5 (figure 2). Following step is the production of R. salina in large scale, 250L tubular photobioreactors. R. salina will be cultivated continuously in chemostat mode under sunlight conditions in two different pH setpoint, 7 and 8.5 (figure 1). The harvest of biomass will be performed with membrane filtration technology provided by VITO and will be transferred to ILVO, where microbial test, volatile analysis and taste sessions will be performed. In addition the free amino acid and nucleotide profile of the produced biomass will be performed and investigate the correlation of the biochemical composition with the taste session results.
Want to stay up to date with all the latest ValgOrize news?
Receive our newsletter in your mailbox every 6 months!